
Authors: Prisha S. Patel and Robert Grammer
Institution: Belmont University, 1900 Belmont Blvd, Nashville, TN 38212
ABSTRACT
This study developed a method for the assay of respiration in free swimming Caenorhabditis elegans (C. elegans). The technique employed direct monitoring of acidification of medium by these nematodes. Samples which might affect respiration were examined, including sugars and Escherichia coli (E. coli), the laboratory food source for C. elegans. The bacteria stimulated respiration but the sugars did not. The decrease in fluid environment pH is blocked by sodium azide, a known mitochondrial inhibitor. This monitoring was achieved using pH probes. Previous work from this lab monitored pH change by spectrophotometric shifts in absorbance of pH-sensitive dyes. That work demonstrated that worms were viable throughout the experiment, there was a decrease in pH, and the effect of sodium azide. However, the absorption shift of the dye had to exactly match the pH range of the acidification. Due to this and other reasons related to spectrophotometry of potential effectors of respiration to be tested, the use of pH probes was investigated. We anticipate that this method will be useful for further characterization of respiration in swimming worms, including temperature and inhibitor effects, as well as investigation of known mutants, pharmacological agents, and other bacterial food sources.
INTRODUCTION
Caenorhabditis elegans are 1 mm-long, non-parasitic nematodes that can be found in the soil. They are utilized as model organisms because they are transparent, easy to maintain, inexpensive, have a sequenced genome, and have a rapid life cycle (Corsi et al., 2015). Their primary food source is Escherichia coli, a gram-negative bacterium. C. elegans provide chemotaxis indices via chemotaxis assays; chemotaxis is the movement towards or away from an attractant or a repellent, respectively (Bargmann, 2006). A mitochondrial inhibitor, sodium azide, is utilized to stop the worms once they move to the test or control spots during chemotaxis assays. Sodium azide blocks cytochrome c oxidase and adenosine triphosphate (ATP) synthase, which causes the worms to die due to inhibition of the respiration processes (Massie et al., 2003).
C. elegans can also move by swimming. During the swimming period, the nematodes carry out cellular respiration, which acidifies the medium. The acidification can be detected by phenol red, a pH indicator (Parrish & Grammer, 2012). Phenol red changes colors from red to yellow as the pH level of the solution decreases; hence, the pH becomes acidic. Previously, the color change was analyzed by examining the absorbance of the experimental solutions with a visible light spectrophotometer (Parrish & Grammer, 2012). However, the shift in the absorption spectrum of the dye upon acidification, the pK of the shift, had to exactly match the pH range of the acidification, necessitating changes in dyes employed depending upon which pH decreases were observed. Moreover, the absorption properties of any colored additives to be investigated and the light scattering properties of any potential food sources, such as bacterial suspensions, made it difficult to interpret the spectral properties of the observed mixture due to the use of spectrophotometry. Thus, the use of pH probes was alternatively investigated.
Due to the intracellular oxidation of glucose, phenol red and spectrophotometry can detect color change. It was assumed that exogenous glucose would produce significant acidification of the medium by the worms. As the sugar is oxidized through respiration, carbon dioxide is produced, which causes the medium to acidify. Previous studies have investigated the respiratory processes and demonstrated the dependence of absorption of pH indicators on time and weak dependence of respiration rate on glucose concentration (Parrish & Grammer, 2012).
This study developed procedures to further detect respiration in C. elegans by using Vernier pH probes (Vernier Software and Technology, Beaverton, OR) and tested the effects of E. coli and different carbohydrates (glucose, fructose, and maltose) on respiration rates. It was hypothesized that Vernier pH probes could be utilized to detect respiration and that E. coli and glucose would show the highest respiration rates, even if all carbohydrates were metabolized to some degree. The addition of E. coli should reveal increased respiration rates because it serves as the main food source for C. elegans. Glucose was also expected to reveal high respiration rates as it is the principal substrate for respiration.
This method was developed to allow further characterization of respiration in swimming worms, such as temperature and inhibitor effects. Moreover, the technique could address other investigative questions. It was found that C. elegans switch from a continuous mode of swimming to an episodic form (Ghosh & Emmons, 2008). Is respiration rate affected by the switch from one mode to another? Recent reports indicate that energy consumption of C. elegans is larger while swimming than while crawling. Additionally, worms were found to be significantly energy-depleted after a single session of swimming (Laranjeiro et al., 2017). Is this depletion reflected in respiration rates? Nicotine has been reported to increase the rate of crawling on agar by C. elegans (Feng et al., 2006). However, the effect of nicotine on respiration in swimming worms has not been reported. These topics of interest, as well as investigation of known mutants and other bacterial food sources (Shtonda & Avery, 2006), are areas of study to which this technique could make a significant contribution.
MATERIALS AND METHODS
Reagents
All chemicals and reagents used in this experiment were purchased from Sigma-Aldrich Corporation, St. Louis, MO. All microbiological media were obtained from Fisher Scientific International, Inc., Pittsburgh, PA.
Strains
The wild type N2 strain of C. elegans and the OP50 strain of E. coli were utilized in this experiment. These strains were provided by the Caenorhabditis Genetics Center, which is funded by NIH Office of Research Infrastructure Programs (P40 OD010440).
S basal stock solutions for washing C. elegans
The S basal stock solution for washing food bacteria off worms (Hope, 1999) was made by adding 5.85 g NaCl, 1 g K2HPO4, and 6 g KH2PO4 into an Erlenmeyer flask which was then filled with 1 L deionized water and autoclaved. After autoclaving and cooling, 1 mL cholesterol stock (5 mg/mL in ethanol) was added to the solution (Hope, 1999).
Luria Broth as bacterial food source
The following reagents were added to an Erlenmeyer flask to make Luria Broth solution for liquid culture of E. coli (Hope, 1999): 10 g Bacto-tryptone, 5 g Bacto-yeast, 5 g NaCl, and deionized water to fill the flask up to 1 L. Sodium hydroxide was added to the Erlenmeyer flask to obtain a pH of 7.0 (Hope, 1999). The solution was then autoclaved.
Nematode Growth Medium (NGM) plates for growth of C. elegans
To prepare the nematode growth medium, 3 g NaCl, 17 g agar, 2.5 g peptone, and 975 mL deionized water were added to an Erlenmeyer flask and autoclaved (Hope, 1999). After the solution cooled to room temperature, 1 mL of sterile 1 M CaCl2, 1 mL cholesterol stock (5 mg/mL in ethanol), 1 mL sterile 1 M MgSO4, and 25 mL sterile 1 M K3PO4, pH 6.0, were added (Hope, 1999). Plates were poured and incubated to ensure absence of contamination.
Growing E. coli
E. coli was inoculated into Luria Broth and incubated at 37°C for 24 hours. After this period, the E. coli was stored at 21°C. New cultures were made weekly.
Growing C. elegans
A lawn of OP50 E. coli was grown on the NGM plates for 24 hours at 37°C. Worms were chunked onto the plate and stored at 21°C. The worms were utilized three to five days after chunking.
Washing of the C. elegans
The C. elegans were washed off of the Nematode Growth Medium (NGM) plate twice with 1.5 mL S basal each time. The plate was tilted, and the S basal containing the C. elegans was pipetted into a microcentrifuge tube. The nematodes were allowed to settle for three minutes. Then, the supernatant was removed. The worms were washed with 1.5 mL S basal two more times with three minutes of settling down prior to the removal of the supernatant during each wash. The C. elegans were then washed with 1.5 mL reverse osmosis-purified (RO) water and allowed to settle for three minutes prior to the supernatant being removed. Reverse osmosis-purified water was utilized because the pH of DI water is less than 6.0, which causes a drop in the initial pH reading (Kulthanan et al., 2013). Since RO water has a pH closer to 7.0, the initial drop in pH is minimized. After the washing, the volume of the pellet was recorded.
Assay solutions
Solutions of 1.6 mM glucose and 1.6 mM fructose were prepared by adding 4.505 g of the respective sugar to 100 mL deionized water. A solution of 1.6 mM was made by adding 8.558 g of the respective sugar to 100 mL deionized water.
Baseline Experiment
Three conical test tubes were set up for each trial. The first conical was labelled as “control” and prepared by adding 1.383 mL RO water and a micro-stir bar. The second conical was labelled as “no sodium azide” and prepared by adding 1.133 mL RO water and a micro-stir bar. The final conical was labelled “sodium azide” and prepared by adding 1 mL RO water, 0.133 mL 1 M sodium azide, and a micro-stir bar. The washed C. elegans were re-suspended in 0.5 mL RO water and 0.25 mL of the suspended worms were added to the each of the conical labelled “sodium azide” and “no sodium azide.” The rack of conicals was placed onto a stirrer set at 80 rpm, and Vernier pH probes and a LabQuest were utilized to follow the pH for 60 minutes.
Detection of respiration with substrates
The setup for this experiment was similar to the setup of the Baseline Experiment. Prior to adding the re-suspended worms, 10 μL E. coli, 10 μL 1.6 mM glucose, 10 μL 1.6 mM fructose, or 10 μL 1.6 mM maltose were added to each of the three conicals.
Statistics
Data was analyzed for significance with the unpaired T-test: equal variance, one tail on Excel. A p-value less than 0.05 was considered significant.
RESULTS
In the figures to follow, C = control, a measure of pH in RO water with no worms added; N = no azide, trials which contained worms in RO water but no mitochondrial inhibitor; and A = worms added to RO water in the presence of the mitochondrial inhibitor, sodium azide. All trials with worms, whether in the presence or absence of inhibitor, were normalized to control trials without worms to compensate for any drift of pH due to external environment. For example, C – N refers to pH changes with live worms undergoing respiration.
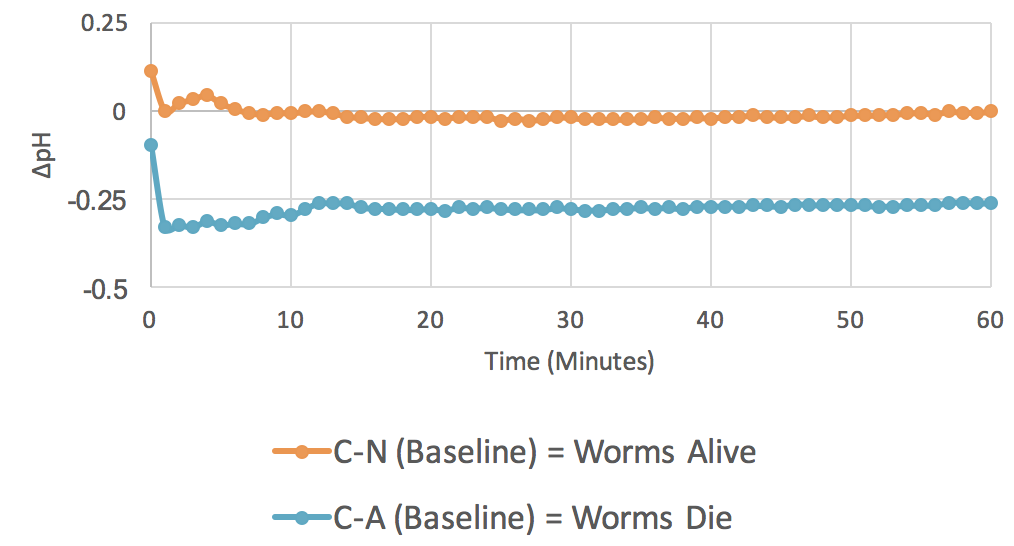
Figure 1. Baseline Experiments (n = 12). The graph plots average changes in pH over time for two parameters: control minus no azide (C-N) and control minus azide (C-A).
Detection of Respiration with Vernier pH Probes
The baseline experiment was conducted to see if the outlined procedures can detect respiration. So, an increase in C – N over C – A shows acidification of the RO water when respiration is occurring. The baseline experiments also served as controls for later experiments with possible respiration effectors added. Results are shown in Figure 1.

Figure 2. 10 µL E. coli (n = 8). The graph plots average changes in pH over time for two parameters: control minus no azide (C-N) and control minus azide (C-A). This shows that when mitochondria are not inhibited by azide, respiration is stimulated by the presence of the food source, E. coli.
Different substrates were tested to see their effects on respiration rate. To determine the effect of the worms’ preferred food source on respiration rates, 10 µL E. coli was added to the setup. These results are shown in Figure 2.
After obtaining data measuring the effect of E. coli on respiration rates, the effects of different sugars on respiration were tested individually. Additions of 1.6 mM of glucose, 1.6 mM of fructose, and 1.6 mM of maltose were tested, as shown in Figures 3-5.

Figure 3. 10 µL Glucose (n = 3). The graph plots average changes in pH over time with relation to two parameters: control minus no azide (C-N) and control minus azide (C-A). This indicates the results of change in pH when C. elegans are incubated with glucose, both with and without the presence of the mitochondrial inhibitor azide.
The slopes presented in Figure 6 are obtained from the 20-minute to 50-minute timespan in Figures 1-2. The slopes from the baseline experiments (Figure 1) are presented for comparison. Significant differences in respiration rates were found between the baseline (C-N) and 10 µL E. coli (C-N) and between 10 µL E. coli (C-N) and 10 µL E. coli (C-A) using the unpaired t-test: equal variance, one-tail.

Figure 4. 10 µL Fructose (n = 3). The graph plots average changes in pH over time with relation to two parameters: control minus no azide (C-N) and control minus azide (C-A). This indicates the results of change in pH when C. elegans are incubated with fructose, both with and without the presence of the mitochondrial inhibitor azide.
The slopes presented in Figure 7 are obtained from the 20-minute to 50-minute timespan in Figures 1 and 3-5. Baseline slopes are presented for comparison. There was no significant difference found from the unpaired t-test: equal variance, one-tail. However, trends were noted between the live and dying worms in fructose (p = 0.08) and in maltose (p = 0.06).
DISCUSSION

Figure 5. 10 µL Maltose (n = 3). The graph plots average changes in pH over time with relation to two parameters: control minus no azide (C-N) and control minus azide (C-A). This indicates the results of change in pH when C. elegans are incubated with maltose, both with and without the presence of the mitochondrial inhibitor azide.
This study attempted to develop a technique to detect respiration in C. elegans and investigate the effects of different additives, sugars and E. coli, on their respiration rate. It was hypothesized that if the medium becomes acidic, the Vernier pH probes would be able to detect respiration rates in C. elegans. Additionally, if there is a difference in respiration rates due to substrates, E. coli and glucose should show significant differences in respiration rates. Baseline experiments demonstrated that the pH probe technique utilized was able to detect respiration (Figure 1); furthermore, different additives did affect respiration rates (Figure 2-5). For example, the addition of 10 µL E. coli (Figure 2) showed significantly steeper slopes compared to those of the baseline experiment and the other additives. It is important to note that in each of the figures, the slopes are not smooth or steady during the first 20 minutes and after 50 minutes. This result is most likely due to the diffusion of carbon dioxide from the air into the tubes while preparation is occurring. Therefore, these regions were not considered for further analysis.

Figure 6. Baseline experiments (n = 12), 10 µL E. coli (n = 8), and 30 µL E. coli (n = 4). The means of the trials are graphed. Respiration rate was determined by finding the slope between 20 minutes and 50 minutes. Unpaired t-test: equal variance, one-tail showed significance (p < 0.05*, p < 0.005**).
In Figure 6, the slopes or respiration rates of C. elegans with their food source, E. coli, are presented. Compared to the baseline experiments, there was a significant difference in respiration rates with 10 µL E. coli, indicating that sugars alone, at least in the concentrations used, are not enough to stimulate respiration and that other nutrients in the bacterial sample, or even an increase in sugars provided by the E. coli are necessary for measurable respiration to occur.

Figure 7. Baseline experiments (n = 12), 10 µL 1.6 mM Glucose (n = 3), and 10 µL 1.6 mM Maltose (n = 3). The means of the trials are graphed. Respiration rate was determined by finding the slope between 20 minutes and 50 minutes. Unpaired t-test: equal variance, one-tail showed no significance.
In Figure 7, the respiration rates from adding different sugars are presented. Neither glucose, maltose, nor fructose showed significance in respiration rates. The 11.6 M glucose may have been too low to affect the respiration rate in swimming C. elegans. Media used in swimming studies that have been reported include some with M9 as the supporting medium (Laranjeiro et al., 2017), a solution that has no significant glucose concentration (Hope, 1999). Coupled with the report that these worms preferentially use lipolysis as an energy source (Laranjeiro et al., 2017), it may not be surprising that exogenous glucose in micromolar amounts had a small effect on respiration, suggesting the possibility for future experiments with added sugars at much larger concentrations.
All data gathered to date are consistent with the interpretation that respiration in C. elegans can be detected with Vernier pH probes. The technique is much simpler and more inexpensive than microfluidics/luminescence (Lin and Huang, 2017) or respirometers (e.g., Koopman et al., 2016). Future studies should investigate the effects of E. coli concentration as well as other bacterial food sources, including pathogenic strains such as Bacillus thuringiensis 4A4 (Iatsenko, 2014). Additional research could also examine the effect of increased concentrations and varieties of sugar solutions, lipids, and even pharmaceutical treatments, such as nicotine and caffeine, on respiration rates (Urushihata et al., 2016). Due to its reduced cost and higher level of efficiency, this procedure could also potentially be adopted by teaching and learning labs that use worms as an alternative to counting worms on petri dishes (Goldstein, 2009).
ACKNOWLEDGMENTS
We would like to acknowledge the Department of Biology at Belmont University for funding.
REFERENCES
Bargmann, C. (2006). Chemosensation in C. elegans. WormBook, ed. The C. elegans Research Community, WormBook. doi:10.1895/wormbook.1.123.1
Corsi, A., Wightman, B., & Chalfie, M. (2015). A transparent window into biology: a primer of Caenorhabditis elegans. WormBook, ed. The C. elegans Research Community, WormBook. doi:10.1895/wormbook.1.177.1
Feng, Z., Li W., Ward A., Piggott, B. J., Larkspur, E. R., Sternberg, P. W., & Shawn Xu, X. Z. (2006). A C. elegans model of nicotine-dependent behavior: regulation by TRP family channels. Cell, 127(3), 621–633.
Ghosh, R. & Emmons, S. (2008). Episodic swimming behavior in the nematode C. elegans. Journal of Experimental Biology, 211(23), 3703-3711.
Goldstein, J. (2009). A lab using C. elegans to investigate the nervous system and behavior. ABLE Tested Studies for Laboratory Teaching, 30, 396-401.
Hope, I. (1999). C. elegans: A Practical Approach. Oxford: Oxford University Press. 281.
Iatsenko, I., Nikolov, A., & Sommer, R. J., (2014). Identification of distinct Bacillus thuringiensis 4A4 nematicidal factors using the model nematodes Pristionchus pacifus and Caenorhabditis elegans. Toxins, 6(7), 2050-2063.
Koopman, M., Michels, H., Dancy, B. M., Kamble, R., Mouchiroud, L., Auwerx, J., … Houtkooper, R. H. (2016). A screening-based platform for the assessment of cellular respiration in Caenorhabditis elegans. Nature Protocols, 11(10), 1798–1816.
Kulthanan, K., Nuchkull, P., & Varothai, S. (2013). The pH of water from various sources: an overview for recommendation for patients with atopic dermatitis. Asia Pacific Allergy, 3(3), 155-160.
Laranjeiro, R., Harinath, G., Burke, D., Braeckman, B., & Driscoll, M. (2017). Single swim sessions in C. elegans induce key features of mammalian exercise. BMC Biology, 15(1), 1-17.
Massie, M., Lapoczka, E., Boggs, K., Stine, K., & White, G. (2003). Exposure to the metabolic inhibitor sodium azide induces stress protein expression and thermotolerance in the nematode Caenorhabditis elegans. Cell Stress and Chaperones, 8(1), 1-7.
Parrish, M., & Grammer, R. (2012). Spectrophotometric determination of respiration rates in C. elegans. Belmont Undergraduate Research Symposium.
Shtonda, B. B., & Avery, L. (2006). Dietary choice behavior in Caenorhabditis elegans. Journal of Experimental Biology, 209, 89-102.
Urushihata T., Takuwa H., Higuchi Y., Sakata K., Wakabayashi T., Nishino A., & Matsuura T. (2016). Inhibitory effects of caffeine on gustatory plasticity in the nematode Caenorhabditis elegans. Bioscience, Biotechnology, & Biochemistry, 80(10), 1990-1994.
Yu-Wei Lin, Y-W., & Huang, S-H. (2017). Metabolic profile analysis of a single Caenorhabditis elegans across the lifespan within a microfluidic device. 2017 19th International IEEE Conference on Solid-State Sensors, Actuators and Microsystems (TRANSDUCERS). Retrieved from http://ieeexplore.ieee.org/document/7994383/