

This article was originally published with Teo Ruijie Darius as the author. Upon the author’s request the name was updated to be consistent with their other publications.
Author: Ruijie D. Teo
Institution: Raffles Junior College
Date: March 2008
ABSTRACT
Due to the interesting structure, properties and applications of microwires, the electromagnetic properties (DC conductivity, dielectric permittivity and magnetic permeability) of composites with various concentrations of short microwire were investigated for the first time. This study is the first to investigate the electromagnetic properties of microwires in a composite form. The conductivity of the composites was obtained by measuring the resistance of the samples. Permittivity and permeability were determined by impedance method over the frequency range from 1MHz to 1 GHz. The percolation phenomenon was observed in this composite, with the percolation threshold between 1 and 2 wt%. The permeability and the permittivity of the composites increased with increasing concentrations of microwire. It is also proven that Maxwell-Garnett and Bruggeman effective medium theory is still valid for composites with microwires of random distribution. These results lend support to the idea that the microwire-epoxy composites have indeed high permeability and permittivity with small concentration of microwires between weight concentrations from 1 to 13%. Understanding these properties of these microwire composites can allow us to use them in high attenuation, shielding and defense applications.

Figure 1: Contacting Electrode Method for measuring dielectric permittivity. The microwire-epoxy composite is sandwiched between two electrodes to form a capacitor. This method derived permittivity by measuring the capacitance of the electrode contacting the material under test (MUT) directly.
INTRODUCTION
Composite materials are defined as engineered materials which are made from two or more constituents with significantly different physical or chemical properties and which remain separate and distinct within the finished structure. The main advantage composites have to offer is their ability to provide properties not obtainable from homogenous materials. For example, the earliest composite made was with straw and mud in the form of bricks for constructing buildings by the Israelite. As shown from the following example, composites materials consist of two components the matrix and the reinforced material. The mud acts as the matrix which supports the reinforced material (straw) by holding it firmly together (Australian Academy of Science 2000). The straw gives unique properties such as physical, mechanical, electrical properties etc to the matrix. Another example of a composite is fiberglass reinforced polymer. It is a combination of glass fibers of various lengths and resins such as vinyl ester or polyester. Being light and sturdy, it is often used in the manufacture of canoes, sailing boats, cars and other forms of transportation vehicles.
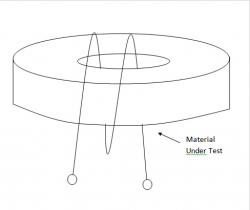
Figure 2: Inductance measurement method for measuring magnetic permeability. Effective permeability of magnetic material was derived from the self-inductance of a cored inductor that has a closed loop.
However, composites need not only be used for structural advantages. Electromagnetic applications of composites are growing rapidly in industries today. Composites vary from one another in terms of electromagnetic properties since composites are made up of fillers of different concentrations. Composites can be designed with electromagnetic properties, making them useful for both civilian and defense applications. For instance, composites can be used as novel antenna designs and protection against high power transients in densely packed printed circuits. For electromagnetic compatibility (EMC) and electromagnetic interference (EMI) applications, the materials are required to have a certain magnitude of dielectric loss or magnetic loss. For example, composites with high dielectric and magnetic loss, and also high conductivity, which help to absorb propagated microwave energy, are often used as electromagnetic shielding materials. This process limits the propagation of electromagnetic fields between two locations, by separating them with a barrier made of magnetic or conductive material. An application of electromagnetic shielding materials is the door of a microwave oven, which has a screen built into the glass of the window (Alulight International GMBH 2002). Other applications of RF shielding includes preventing access to data stored on Radio Frequency Identification (RFID) chips embedded in various devices, such as biometric passports, which is essentially a combined paper and electronic identity document that uses biometrics to authenticate the citizenship of travelers.

Figure 3: Scanning Electron Microscope Image of the short fibers from microwire. It shows that the size of the microwire metal core is about 5 μm in diameter and the total thickness with glass coating is about 13 μm.
One type of composite material with numerous possibilities for electromagnetic applications is microwires. Each microwire consists a metal body and a glass coating. The size of the metal core is 5 μm in diameter and the glass coating is 10 μm in thickness. The main body of the microwire is composed of a ferromagnetic alloy, the composition of which varies depending on the metals used in the alloy and on the final dimensions of the thread. As a result, by balancing these two factors, the range of microwires that can be obtained is very wide. But there is one quality that they all have: they all have magnetic properties. It is precisely these magnetic properties and their diminutive size that makes them so appreciated. However, as demonstrated in this study, the electromagnetic properties of microwire composite can also differ with various concentrations of epoxy.

Figure 4: X-Ray Diffraction pattern which shows that the short microwire used in this study is amorphous.
Before a composite material like microwire can be used in electromagentic applications, we must first understand certain properties pertaining to the material. Specifically, it is important to know the material's electrical conductivity, dielectric permittivity, magnetic permeability, and it is useful to understand how it behaves according to the percolation theory and Maxwell-Garnett and Bruggeman effective medium theory (Schaffer, Saxena, Antolovich, Sanders & Warner 2003). The definitions of the properties are elaborated as follows.
The electrical conductivity σ is defined as the measure of a material's ability to conduct an electric current. When there is a potential difference across a conductor, the charges flow, giving rise to current. The magnitude of conductivity is dependent on three factors, namely the number of mobile charge carriers per unit volume, the charge per carrier and the mobility of the charge carriers.

Figure 5: Comparison between graph of density against weight fraction with different quantities of short and long fibers. It shows the measured and calculated values of the microwires. This may lead to slight fluctuations in the trends for permeability and permittivity measured.
Dielectric permittivity ε reflects the ability of the material to be polarized by the electric field. Permittivity is a complex quantity of the form: ε* = ε' - i ε''. The real part of the complex notation is often used to describe the named property, whereas the imaginary part describes the loss processes. The real part (ε') is thus otherwise known as the dielectric constant and the imaginary part (ε'') is known as the dielectric loss factor. The dielectric loss results when an alternating electric field is applied to a dielectric and some of the input power is converted into heat energy (Agilent Technologies 2006). The reason is because the dipoles inside the dielectric are not able to respond to the field effectively, instead, they experience drag or friction from neighbours. The dielectric loss factor (ε"/ ε') is a major consideration for the usefulness of a dielectric material in EMC/EMI applications. A high dielectric loss factor would mean a high power loss which would thus render the material unsuitable to function as a dielectric material. It is hypothesized that the relative permittivity and the dielectric loss of the composite will increase with concentrations of microwire inclusions.
Magnetic permeability μ is the degree of magnetization of a material that responds to an applied magnetic field. Permeability is a complex quantity with the imaginary part representing magnetic loss which is also an important factor in shielding or attenuating applications. The permeability is thus predicted to increase with concentrations of microwire inclusions due to increasing magnetization.

Figure 6: Graph of conductivity against weight concentration. The percolation phenomenon (sudden rise in conductivity) is between 1% and 2%.
Percolation theory deals with fluid flow in random media. If the medium is a set of regular lattice points, then there are two types of percolation. A site percolation considers the lattice vertices as the relevant entities; a bond percolation considers the lattice edges as the relevant entities. Because the composites are made up of connected clusters of microwire, we expect that microwire composites can be described as percolated systems.
The Maxwell-Garnett and Bruggeman effective medium theory essentially describes the macroscopic properties of a medium based on the properties and the relative fractions of its components. The properties under consideration are usually the conductivity σ or the dielectric constant ε of the medium. The Maxwell-Garnett and Bruggeman effective medium theory is thus predicted to be valid for composites with microwires of random distribution.
In this project, the electromagentic properties of the microwire-epoxy composite are being studied for the first time. The validity of the Maxwell-Garnett and Bruggeman effective medium theory for composites with microwires of random distribution was investigated. Samples with weight concentrations of the microwire varied from 1% to 13% embedded in the epoxy matrix were fabricated first. Then impedance analyzer and insulation multi-meter were used to measure the electrical, dielectric and magnetic properties of microwire composite. The trends from the graphs plotted were then being investigated and elaborated. The dependence of such properties on the concentration of microwire is discussed finally.

Figure 7: Variation of dielectric constant with different concentrations of microwire
PROCEDURE
Fabrication of Microwire-Epoxy Composite
Epoxy, a thermosetting epoxide polymer, produced from a reaction between epichlorohydrin and bisphenol-A, was mixed with hardener in the ratio 9:1 and being stirred manually in a crucible for 5 minutes. Various amounts of short microwire were then weighed using a digital analytical balance with accuracy of 0.0001g. The weight concentration of the microwire varied from 1% to 13% with seven different scales. The microwires were then added to the crucible, together with the epoxy and hardener, to be stirred manually for another 10 minutes. The microwires have to be carefully mixed with the epoxy and hardener in order to ensure uniform dispersion of microwire in the matrix, and also that no air bubbles are formed during the process as this may affect our results.
After the stirring, the mould was sprayed with mould-release agent that prevents the mixture from adhering to the mould. The mixture of a particular concentration of microwire was then poured into the mould and screwed on tightly. This ensured that the mixture distributed evenly within the mould. The mould was then cured in an oven at 68oC for 24 hours. For every concentration of microwire, two types of samples pellet-shaped and toroidal-shaped were fabricated. The pellet samples were used to measure the DC conductivity and permittivity while the toroidal samples were used for measuring and permeability. The composites were also imaged using the Scanning Electron Microscope and the structure determined using X-Ray Diffraction.
Measurement of Density
The densities of the samples fabricated were investigated in order to ensure that the electromagnetic and the conductivity results gained from the experiment are accurate. The mass of the sample was measured using the digital analytical balance and the dimension of the sample was measured with digital calipers. After knowing the mass and the volume of the sample, the density can be calculated. However, when measuring the volume of the sample, extra precaution has to be taken in order to ensure that the digital calipers would not compress the sample, as a slight change in shape may result in a change in density of the composite. When calculating the theoretical densities of the samples, the densities of the epoxy resin and microwires were 1.07 g/cm3 and 3.80 g/cm3 respectively which were obtained from measurement (Refer to Appendix for algorithm to calculate the theoretical densities).
Figure 8: Variation of dielectric loss with different concentrations of microwire
Measurement of Permittivity and Permeability
The dielectric properties of the microwire-epoxy composite were measured using the capacitance method from frequency range of 1 MHz to 1GHz. When measuring permittivity using the impedance/material analyzer (Agilent E4991A), the capacitance method was employed. An overview of the parallel plate method is shown in Figure 1. This method involves sandwiching a thin sheet of material between two electrodes to form a capacitor. This method derived permittivity by measuring the capacitance of the electrode contacting the material under test (MUT) directly. Permittivity and loss tangent were calculated using the equations as shown in the appendix. Figure 1 shows the schematic map of the capacitance method.
The permeability of the sample was measured using the inductance measurement method. Effective permeability of magnetic material was derived from the self-inductance of a cored inductor that has a closed loop (such as the toroidal core). The conventional method of measuring effective permeability is to wind some wire around the core and evaluate the inductance with respect to the ends of the wire. This type of measurement is usually performed with an impedance-measuring instrument. Effective permeability was derived from the inductance measurement result. (Refer to Appendix for equations). Figure 2 shows the schematic map the inductance method.
Measurement of conductivity
In order to find the resistance of the pellet-type samples, a MeggerTM BMM80TM Insulation Multimeter was used. Before measuring the resistance of the samples, they must be cleaned with ethanol to remove the release agent sprayed on the mould prior to casting as this will affect the results collected. The diameter and the thickness were obtained earlier on using the digital calipers. (Refer to appendix for the conductivity equation).
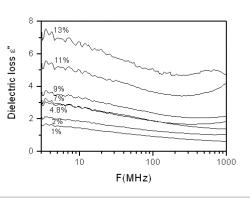
Figure 8: Variation of dielectric loss with different concentrations of microwire Figure 9: Graph of real/imaginary permeability against concentration
RESULTS
Component and Microstructure
Figure 3 is an image of the composite with microwires obtained with SEM (Scanning electronic microscope). It is visible that the size of the metal core is about 5 μm in diameter and the total thickness with glass coating is about 13 μm.
Figure 4 is the X-ray diffraction (XRD) spectrum obtained from the microwire. XRD was being carried out in order to find out the crystalline structure of microwire, which is also known as ferromagnetic alloy. From Figure 4, we can tell the alloy is amorphous instead of crystalline. The alloy contains Fe, Co, Ni, Si and B (Ronsen Super Micro-Wire Co Ltd 2006).
Figure 5 shows the relationship between the density of the microwire-epoxy composite and the weight concentration of the microwire inclusions.
Electrical properties
Figure 6 shows the conductivity of the samples versus the weight concentration of microwire. It was observed from the graph that the percolation phenomenon (sudden rise in conductivity) is between 1% and 2% (Brian Berkowitz and Robert P.Ewing 1998). The conductivity of the sample was at 1E-9.5 S/cm when the weight concentration is at 1%. However, the conductivity of the sample was at 1E-3.5 S/cm when the weight concentration is 2%.
Dielectric and magnetic properties
Figure 7 shows the permittivity of all the composites with the different filler concentrations of microwire. In particular, ε' is approximately 14 for the 1% sample below the percolation threshold as compared to 26 for the 5% sample above the percolation threshold.
As the 5% sample has a much higher permittivity value than the 1% sample, it also has a higher dielectric loss factor (ε''). Figure 8 supports this as it shows the dielectric loss factor for the 1% sample being approximately 1.8 while the 5% sample has a factor of 3.
The real permeability of the 5% sample is observed to be also higher than that of the 1% sample. From figures 9 and 10, it can be observed that as the weight concentration increases, the initial permeability (the values at 1 MHz) of the samples also almost linearly increases.
The relative standard deviation from figures 7 to 10 are about 5%.
DISCUSSION
Component and Microstructure
At higher concentrations of the microwire, the manual mixing of the substances become more difficult as the viscosity of the mixture is high. This will thus lead to non-uniform dispersion of the microwire. Therefore, it is important to check the densities of the microwire-epoxy composites against the weight concentration of the microwire in order to ensure that the results will be accurate. From Figure 5, it is evident that the densities of the composites with weight fraction of 0.02, 0.09 and 0.10 slightly lower than the theoretical densities as compared to the rest of the composites. A possible explanation would be that the mixture was mixed imperfectly, the dispersion of the microwire was non-uniform or with the air bubbles inside. Therefore, extra precaution has to be taken when checking the electromagnetic and conductivity results for these composites.
Electrical properties
The percolation theory predicts that there will be low conductivity below the percolation threshold (pc), as there are no connected clusters of microwire. This can be seen from Figure 6 whereby the conductivity only increased slightly below samples with weight concentration of 2%. However, a sharp increase in conductivity occurs when the weight concentration of microwire goes above 1%. During sample preparation, mixing process might dislocate part of the glass coating from the microwires. The probability of forming conducting paths of microwires is higher at higher concentration. The conductivity of the samples increases as more conducting paths of microwire are present. In order to obtain a more accurate result for the percolation threshold, more tests have to be carried out.
Dielectric and magnetic properties
It can be observed that the dielectric constant increases with higher concentrations of microwire. This is so as when larger amounts of microwire are present, the composite has a higher ability to be polarized by an electric field.
Figure 8 shows that the ε'' of the 5% sample is almost twice that of the 1% sample. A trend can be observed between the dielectric loss and the weight concentration of microwire. When higher amounts of microwire are present in the samples, the dielectric loss of the samples increases. Since the amounts of microwire present increases, a change in motion in the dipole rotation would require more energy, therefore leading to a higher power loss. Figure 9 presents the permeability measurements of all the samples with various filler concentrations measured at frequency range of 1MHz to 1GHz using the inductance measurement method. The high magnetic loss of the composite measured means it is good for various electromagnetic applications. The sample with filler concentration of 5% has a much higher magnetic loss of about 5 times as compared to the sample with filler concentration of 1%. μ'' of both 1% and 5% samples fluctuated. The μ'' of 1% sample is estimated to be 0.7 while μ'' of 5% sample is estimated to be around 5.
However, more samples with different concentrations of microwire have to be fabricated and measured in order to determine accurately the relationship between the concentration of microwire and the frequency dependence of the permittivity. The microwires being covered by an isolation layer of glass is actually a minor factor relative to errors such as estimating the weight percentage of microwires.
It is known from Maxwell-Garnett and Bruggeman effective medium theory (EMT) (Pierre-Marie Jacquart and Olivier Acher 1996) that the parallel permeability of microwire composite almost linearly depends on the concentration of the inclusion when the intrinsic permeability value of the inclusion is much higher than that of the holding matrix. The imaginary permeability at each concentration in Figure 9 is the peak values of curves that also linearly depends on the concentration of the microwire. It has been proven that EMT is still valid for composites with microwires of random distribution.
CONCLUSION
DC conductivity, dielectric permittivity and magnetic permeability of microwire-epoxy composites were investigated for weight concentration from 1% to 13% for the first time. Through experimentation, it was found that the composite is a percolated system, with the percolation threshold between 1% and 2%.
It was found that the relative permittivity and the dielectric loss of the composite increases with concentrations of microwire inclusions. The real and imaginary permeability almost linearly (R.S.D. ~ 5%) depend on the concentration of microwire inclusions.
Because these microwire composites that have demonstrated high permeability and permittivity with small concentration of microwires, they have great potential to be used in future high attenuation or shielding applications. Other than being used in electromagnetic industries, they can also be applied to electromagnets, electric motors and inductor cores in which the primary objective is to generate as much magnetic induction as possible under the action of a magnetic field.
ACKNOWLEDGEMENTS
This project has been supervised by Dr Liu Lie (Mentor from Temasek Lab). The author wishes to express his utmost gratitude to Dr Zhang Yong Jian (Co-mentor from Defence Science Organization Laboratories of Singapore), Dr Deng Chao Ran (DSO), Ms Sim Hui Koon (DSO), Dr Kong Ling Bing and Ms Stacey Teo Mei Lin for their help on measurement and sample preparation throughout this project.
REFERENCES
Australian Academy of Science (2000) Putting it together the science and technology of composite materials. http://www.science.org.au/nova/059/059key.htm. Accessed: 8 December 2006
Alulight International GMBH (2002) Electromagnetic Shielding. http://www.alulight.com/english/products/shielding.htm. Accessed: 9 December 2006
Schaffer, Saxena, Antolovich, Sanders & Warner (2003) The Science and Design of Engineering Materials, 2nd Ed. McGraw Hill Companies: 429-522
Agilent Technologies (2006) Agilent Solutions for Measuring Permittivity and Permeability with LCR Meters and Impedence Analyzers: 50-54
Petra Potschke, Sergej M.Dudkin and Ingo Alig (2003) Dielectric spectroscopy on melt processed polycarbonate-multiwalled carbon nanotube composites Polymer 44: 5023-5030
Brian Berkowitz and Robert P.Ewing (1998) Percolation Theory and Network Modelling Applications in Soil Physics, Surveys in Geophysics Vol.19, Number 1, Springer Science: 23-72.
Parker, R.J (1990) Introduction to Magnetism and Magnetic Materials, Chapman & Hall: 75-88
Pierre-Marie Jacquart and Olivier Acher (1996) Permeability Measurement on Composites Made of Oriented Metallic Wire from 0.1 to 18 GHz, IEEE Trans. on MTT, V40.
Ronsen Super Micro-Wire Co Ltd (2006) Manufacturer specifications.
Eager Polymers (2006) Manufacturer specifications.
APPENDIX
Calculating the theoretical and apparent densities of the composites
Let the mass of microwire be x, mass of epoxy be z, density of the microwire be 3.80 g/cm3 (Ronsen Super Micro-Wire Co Ltd 2006) and the density of the epoxy be 1.07 g/cm3 (Eager Polymers 2006). The theoretical and apparent densities can be calculated using equation 1 and 2 below.

Equation 1 1493

Equation 2
Calculating permittivity and loss tangent
The dielectric loss factor can be calculated by taking ε"/ ε' as shown in equation 3. The real part (ε') is thus otherwise known as the dielectric constant and the imaginary part (ε'') is known as the dielectric loss factor.

Equation 3

Equation 4
Where CP represents the equivalent parallel capacitance of MUT, D represents the dissipation factor, δ represents the loss angle, tm represents the average thickness of MUT, A represents the guarded electrode's surface area, d represents the guarded electrode's diameter and ε0 which stands for the permittivity of free space (8.854 × 10⁻¹² F/m).
Calculating Effective Permeability
Effective permeability is derived from the inductance measurement result using equation 5 and 6 below.

Equation 5

Equation 6
Where Leff represents inductance of toroidal coil, Lw represents the inductance of the air-core coil inductance, N represents the number of turns, l represents the average magnetic path length of the toroidal core, A represents the cross-sectional area of toriodal core, ω represents 2πf (frequency) and μ0 which stands for 4π X 10-7 H/m.
Calculating conductivity
The formula for conductivity is shown in equation 7:

Equation 7
Where σ represents conductivity, L represents thickness, R represents resistance and d is the diameter of the samples.